/ 67 Market Research Statistics That Will Shape Your Strategy in 2026 /
The market research industry reached $150 billion in 2025. That’s not a typo; $150 billion spent annually on understanding what customers want, how markets move, and where opportunities hide.
This isn’t just about surveys anymore. Market research has evolved from clipboards and focus groups asking if you like red or blue, into an AI-powered intelligence machine that’s reshaping how businesses make decisions. And 2025 marks an inflection point: artificial intelligence, synthetic data, and mobile-first methodologies are now essential.
Market Research Industry Size and Growth Statistics
Market research is massive and growing. Understanding its scale helps contextualize why this matters. Where money flows reveals where businesses grow.
Data obtained from a range of sources including the Esomar 2025 Global Market Research Report, the 2026 Global Market Research Trends Report, and a range of Statista reports.
The numbers tell a compelling story:
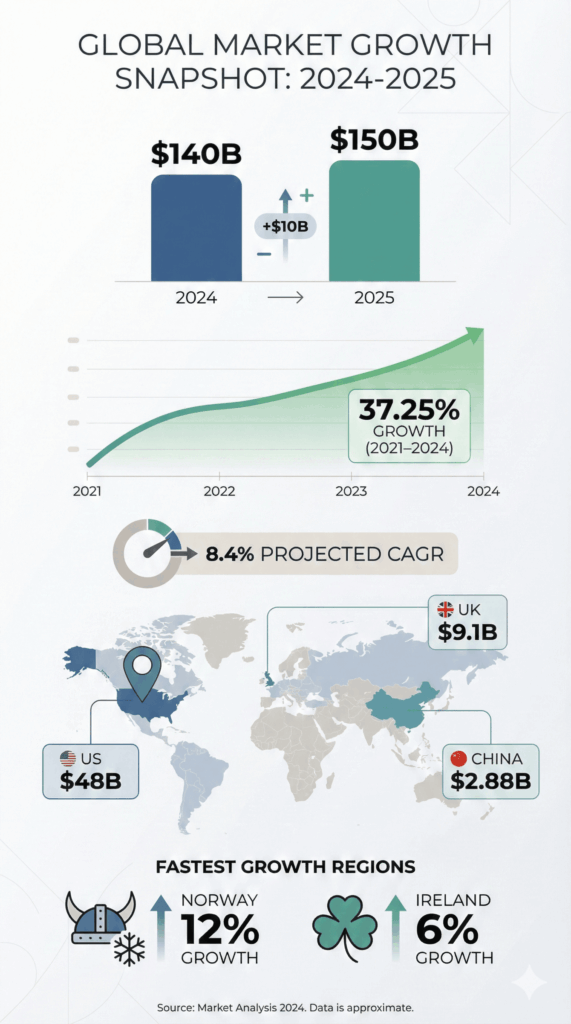
1. The global market research industry generated $140 billion in revenue in 2024, with projections reaching $150 billion by the end of 2025.
2. Between 2021 and 2024, the market research industry grew by 37.25% from $102 billion to $140 billion, a growth rate that outpaces most traditional business services.
3. Projected annual growth rates globally hover around 8.4%.
4. Some forecasts suggest the industry will add $35 billion over the next five years at a 2.5% CAGR.
Regional breakdown reveals interesting patterns:
5. The US leads global market research with $48 billion in turnover.
6. The UK follows with $9.1 billion in market research revenue.
7. China ranks third with $2.88 billion.
8. The US holds 55% of total market research market share—a dominance that reflects both the size of the American economy and the sophistication of its data-driven business culture.
9. In Europe, Norway experienced the fastest growth at approximately 12%.
10. Ireland experienced the second-fastest European growth at approximately 6%.
Employment tells another part of the story:
11. Market research companies employ approximately 129,000 people in the US as of 2023. That’s a small army of professionals dedicated to understanding what makes customers tick.
What this means for you: The market research industry is robust and growing, indicating strong ROI potential. If you’re not investing in research, your competitors likely are. To the tune of billions annually. The question isn’t whether research delivers value—it’s whether you can afford to be the one company in your industry that doesn’t use it.
Top Market Research Companies and Revenue Leaders
The industry is dominated by key players whose revenue indicates market validation. Understanding who leads reveals best practices and hints at where the industry is heading.
12. Gartner holds the #1 position with $5.48 billion in research revenue in 2022.
13. IQVIA ranks second with $5.43 billion in research revenue.
14. Salesforce ranks third at $4.52 billion.
15. Nielsen Holdings generated $3.5 billion globally in 2021.
16. Adobe Systems generated $3.87 billion in research revenue.
Three of the top five aren’t traditional research firms; they’re technology companies. That’s the story hiding in plain sight. The research industry is being owned by tech giants who understand that AI, automation, and integrated platforms are the future.
Learn more about: 15 Best Market Research Software Platforms
17. Notable industry leaders include Nielsen, Kantar, IQVIA, Ipsos, and GfK Group, all traditional agencies that built empires on phone surveys and panel management. They’re still here, still massive, but the competitive landscape has shifted beneath their feet.

What this means for you: Tech giants like Salesforce and Adobe competing in research space signals a fundamental shift toward automated, AI-powered solutions. Traditional agencies must adapt or risk the slow fade into irrelevance. The survivors will be those who embrace AI as an accelerator, not a threat.
Market Research Methods and Service Revenue Statistics
Not all research methods capture equal market share. Revenue breakdown reveals industry preferences and the accelerating shift from traditional to digital methods.
18. Online and mobile quantitative research contributes 35% of worldwide market research revenue.
19. Reporting services account for 20.2% of global revenue.
20. Online traffic and web analytics generates 9.7% of revenue.
21. Online and mobile qualitative research represents 6% of revenue.
22. Social media monitoring accounts for 2.7% of global market research revenue.

The US market shows similar patterns:
23. In the US, 59% of research funding goes to quantitative research.
24. Reporting captures 24% of US research spending.
25. Qualitative research receives 18% of funding in the US.
When we break down spending by survey type:
26. Customer satisfaction surveys capture 16.4% of market research spending.
27. Market measurement accounts for 15% of spending.
28. User experience surveys represent 12.4% of spending.
In the US specifically:
29. CRM systems receive the largest portion at 18% of US market research expenditures.
30. Market measurement follows at 17% of US spending.
31. UX research captures 14% of US spending.
What this means for you: Online and mobile methods dominate spending, indicating where you should focus digital transformation efforts. If you’re still heavily reliant on offline methods, you’re swimming against the tide.
But here’s the insight that separates leaders from followers: quantitative and qualitative shouldn’t be an either/or choice. Mixed methods research, combining quantitative breadth with qualitative depth, delivers insights that single-method approaches miss. With AI reducing the cost and complexity of comprehensive research, there’s no excuse for choosing one when you can have both.
Most Used Market Research Methods Statistics
Revenue doesn’t always equal usage. Some market research methods are more accessible than others. Understanding usage patterns reveals practical trends on the ground.
32. Online surveys rank as the most used quantitative method with 85-90% of researchers using them regularly. Using surveys doesn’t always mean the results or outcomes are helpful, which is important to keep in mind.
Learn more about: 10 Reasons Why Market Research is Important for Sustainable Business Growth
33. Mobile surveys are used by 47-60% of market researchers.
34. Proprietary panels are utilized by 32% of researchers.
35. Phone interviews constitute 80% of quantitative research methods.
36. Face-to-face interviews account for 39% of quantitative methods.
On the qualitative side:
37. Online in-depth interviews with webcams are the most popular qualitative method at 34-41% usage.
38. Online focus groups with webcams are used by 28-40% of researchers.
39. 87% of market researchers conduct at least half their qualitative research remotely or online.
Emerging methods show where the puck is heading:
40. Social media analytics are employed by 36% of companies globally in 2022.
41. Mobile-first surveys are regularly utilized by 28% of researchers.
Learn more about: How to Do Market Research in 2026: A Guide for Data-Driven Decision Making
What this means for you: Online surveys are a basic and accessible tool, with 90% of researchers using them. To differentiate, focus on emerging methods like social media analytics or video feedback that only 28-36% have adopted.
But don’t fall into the trap of chasing novelty. The most comprehensive, holistic solutions blend quantitative surveys with qualitative interviews. AI-moderated interviews now generate 4.5x more insightful words per respondent than traditional surveys. That’s not incremental improvement, it’s a different game entirely.
Mobile First and Digital Research Statistics
Mobile has transformed the research landscape. Respondents expect mobile-optimized experiences. Desktop-only research means missed insights and incomplete data.
42. Globally, 61.1% of survey responses worldwide were submitted from mobile devices in Q3 2024.
Let that sink in: more than six in ten survey responses now come from smartphones.
43. Mobile responses increased from 57.2% in Q3 2023 to 61.1% in Q3 2024.
44. In the US specifically, 51.5% of responses came from mobile versus 47.3% non-mobile in Q3 2024. This is the first time mobile overtook desktop in American survey responses.
45. Mobile survey responses show consistent year-over-year growth.
46. The majority of internet users now access content via mobile devices.
47. Market research is heading in the direction of being almost exclusively online.
48. Traditional face-to-face research is declining in favor of digital methods.
What this means for you: If your surveys aren’t mobile-optimized, you’re losing 60%+ of potential responses. You need to reach the majority of respondents where they actually are. Mobile-first design is a basic necessity for data quality and response rates.
AI in Market Research Statistics
AI is transforming every aspect of market research. 2025 marks the tipping point for AI adoption. Synthetic data is emerging as a game-changer. Researchers are enthusiastic but cautious—and they should be.
49. 83% of market research professionals plan to invest in AI for research in 2025.
50. 47% of researchers worldwide use AI regularly in market research activities.
51. 73% of researchers feel very confident or extremely confident applying AI to research.
52. 25% of researchers are concerned AI impact is outpacing their personal or team skills.
53. Asia-Pacific and Japan lead AI adoption at 58% usage rate.
54. North America lags at 39% AI adoption rate.
55. The AI market is set to grow 38% in 2025.
56. 75% of marketers believe AI-based search positively impacts blogs.
57. 68% of marketers expect more website traffic from AI innovations.
58. Self-serve research platforms surpassed $3.5 billion after what ESOMAR called “stupendous growth.”

What this means for you: North American researchers have a significant catch-up opportunity. The 83% investment intention for 2026 suggests now is the time to develop AI capabilities or accept competitive disadvantage.
Synthetic Data Usage in Market Research
Synthetic data statistics tell their own story:
59. 69% of market researchers have incorporated synthetic data into their research efforts.
60. 87% of teams using synthetic data report positive feedback about results.
61. When synthetic data is trained on real-world survey responses, one study showed a 95% correlation between synthetic and actual survey results.
62. The EY synthetic data survey was produced in days, not months, for a fraction of the cost of a traditional survey.
63. Synthetic data provides solutions to privacy concerns, survey fatigue, and data scarcity.

Synthetic data isn’t replacing real research. But it’s augmenting it, filling gaps, enabling scenario testing, and dramatically reducing time-to-insight. The future belongs to researchers who understand that AI is a force multiplier for human expertise, not a replacement for it.
Industry Spending and Client Sector Statistics
Who’s buying this research? Understanding client sectors reveals growth opportunities. Spending patterns indicate market priorities. Industry-specific trends are emerging that smart researchers should pay attention to.
64. Pharmaceutical companies lead, spending at 16.6% of all market research expenditures.
65. Media and entertainment organizations contribute 15.5% of total spending.
66. Consumer goods producers account for 14.9% of spending.
67. Media and broadcasting were top clients in the US at 29% of research sales in 2022.

Why do pharma companies invest so heavily? Regulatory requirements demand rigorous testing and validation. Media sectors need constant pulse on audience preferences in a rapidly fragmenting landscape. Consumer goods require rapid feedback cycles to stay ahead of shifting tastes.
Profitability ranks as the #1 driver of market research investment. Organizations are increasingly reliant on data-driven strategies. ROI pressure is driving demand for faster, cheaper research, which AI provides.
What this means for you: If you’re in pharma, media, or consumer goods, you’re in industries that already prioritize research. Other sectors are underinvesting relative to these leaders. This is either an opportunity or competitive vulnerability, depending on your appetite for risk and growth.
What These Trends Mean For You; A Data-Driven Future
Trend 1: Digital & Mobile Dominance
Invest in mobile-first, digital-native tools or accept that your data will be incomplete.
Trend 2: AI Becoming Standard
AI skills are required, not optional. The researchers who thrive will be those who learn to collaborate with AI, not compete against it.
Trend 3: Synthetic Data Goes Mainstream
Privacy advantages, cost benefits, and speed improvements are too compelling to ignore. The path forward is complementing real data with synthetic data for scale and scenario testing.
Trend 4: Industry Consolidation
Tech giants are entering research space with serious capital and capabilities. Choose your partners wisely. Scale matters more than ever because training effective AI models requires vast datasets.
Trend 5: Real-Time Intelligence
Speed is increasingly valuable, and agility is essential. The window between insight and action is collapsing.
Learn more about: What is Market Intelligence? Your Strategic Advantage for 2026
Trend 6: Video & Rich Media
Incorporate video for deeper insights. Text-based surveys leave emotional nuance and non-verbal cues on the table.
With AI reducing costs and timelines while maintaining or improving quality, there’s no longer any excuse for choosing between comprehensive research and fast results. The companies that thrive in 2026 and beyond will be those that embrace this new reality: mixed methods research, powered by AI, delivered at the speed of business decisions.
The future of market research belongs to those who understand that technology amplifies human insight rather than replacing it. AI can process millions of data points, identify patterns invisible to human analysts, and generate synthetic datasets that overcome traditional research limitations. But AI can’t replace the strategic thinking that determines what questions to ask, the contextual understanding that interprets surprising findings, or the empathy that recognizes when quantitative data misses qualitative truth.
How fast can you adapt modern research approaches before the gap becomes insurmountable?
Winners will blend AI efficiency with human wisdom. The losers will be those who choose one or the other rather than both. The data is clear. The trends are unmistakable. The only question remaining is: which side of history will you be on? Contact us at Alchemic to blend AI speed and insights with human knowledge and understanding, to create unbeatable advantages and strength.
Frequently Asked Questions (FAQs)
What is the projected market size for the market research industry in 2026?
The market research industry is projected to reach approximately $150 billion in 2026, continuing strong growth from $140 billion in 2024. This represents a 37.25% increase from 2021 levels.
How is AI transforming market research in 2026?
AI is transforming market research through multiple channels: 83% of professionals plan to invest in AI for research in 2025, with 47% already using it regularly. AI enables synthetic data generation (adopted by 69% of researchers), automates analysis to deliver insights in days rather than months, and powers AI-moderated interviews that generate 4.5x more insightful responses than traditional surveys.
What are the most popular market research methods being used in 2026?
Online surveys dominate with 85-90% usage, followed by mobile surveys at 47-60% and phone interviews at 80%. For qualitative research, online in-depth interviews with webcams lead at 34-41% usage, with online focus groups at 28-40%. Emerging methods include social media analytics (36% adoption) and mobile-first surveys (28%).
How are consumer behaviors changing in 2026, and what does market research reveal?
Mobile-first behavior is now dominant, with 61.1% of survey responses submitted from mobile devices. Consumers expect seamless mobile experiences and are comfortable with video-based feedback (34-41% participation in webcam interviews). There’s also increased awareness of data privacy, driving adoption of synthetic data approaches that protect individual information while maintaining research validity.
What ROI can businesses expect from investing in market research in 2026?
While specific ROI varies by industry, the $150 billion flowing into market research annually suggests strong returns. Pharmaceutical companies (16.6% of spending), media organizations (15.5%), and consumer goods producers (14.9%) lead investments because research directly impacts profitability. AI-powered research delivers insights in days rather than months at a fraction of traditional costs, with some synthetic data studies showing 95% correlation to actual results while reducing time-to-insight by 90%.